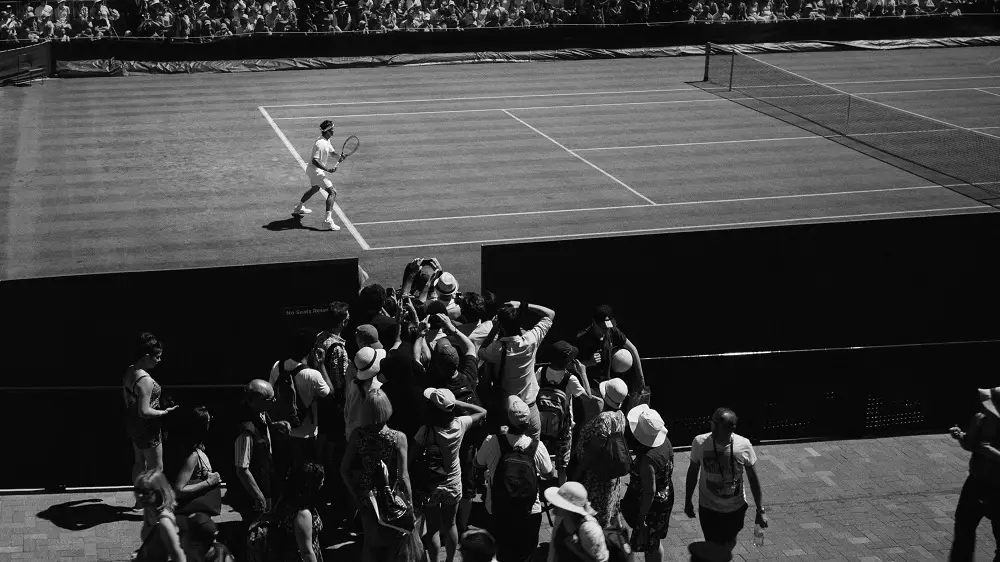
If you are one of those who reminisce those days when tennis courts were a lot quicker and wonder if its your aging eyes or if they have actually become slower, we have an article that takes a deep dive into it.
What we now call the game of tennis is believed to be born during the 11th century, when monks played handball in their monasteries. The game gradually evolved into Real Tennis, which was played on hard surfaces such as wood or stone.
During the 18th century, what was at the time known as Field Tennis gradually became Long Tennis, and was played on grass. This change was going to last long: until the early 1970s, the majority of tennis tournaments were played on grass, including three out of the four Grand Slams – Wimbledon, Australian Open, and US Open.
Some observers think that it is also due to this surface uniformity that Rod Laver managed to complete the Grand Slam twice, while in more recent times, dominating players like Federer in the early 2000s and Nadal or Djokovic during the last decade did not make it, even if, especially Nole got very close to make it.
The fourth Grand Slam tournament, Roland-Garros, in Paris, which had its first edition in 1891, has always been played on clay.
Clay courts originated in Europe and South America: up until the 1980s, they constituted the overwhelming majority of tennis courts in many European countries, such as Italy. It was not until the 1940s that acrylic courts were used in official tournaments.
Currently, both the Australian Open and US Open are played on acrylic courts.
The belief that that tennis courts have become slower over time is one of the trending topics during the latest years. The change is attributed to the materials used to construct the courts, as well as to changes in the way the courts are maintained.
Already in 2001, for example, Wimbledon switched to 100% perennial ryegrass to improve durability of the court, and this was expected to make the surface slower.
Ten years later, in 2011, Roger Federer publicly declared that he was worried about the US Open court to become too slow, which could harm the quality of the game.
Has the trend extended also during the latest years, until today? Did tennis courts become even slower from 2011 on, after Roger Federer’s statement?
Also Read:
We will try to answer the question following Hercule Poirot’s advice.
When he was thinking about a mysterious call when he was chasing an insusceptible killer in “The Murder of Roger Ackroyd”, he said:
“I next examined the motive for the call. That was difficult. I could only get at it by judging its result”.
In the following, instead of directly embarking on a very hard technical analyses about the evolving nature of the different materials constituting the surfaces of tennis courts, just like the Belgian detective, we will try to answer our question by analyzing the consequences of the change (if any).
In other words, we will try to identify and characterize the styles of play which have become less or more effective over time in the main tournaments, the Grand Slam ones, surface by surface, from 2011 until today.
Table of Content
Tools for the Analysis
In the following, in order to develop our analysis, we will use the Spearman’s correlation coefficient. This measurement will help us understand the relationship between two sets of data.
For example, let’s say we have data on the height and weight of a group of people. We can use Spearman’s correlation to see if there is a relationship between height and weight. If the correlation is high, in absolute value, and positive (with a maximum value of 1), it means that taller people tend to weigh more, and vice versa.
If the correlation is high, in absolute value, and negative (with a minimum value of -1) it means that taller people tend to weigh less, and viceversa. If the value of the coefficient is close to 0, it means that knowing the height of a person does not say much about his or her weight.
Spearman’s correlation is particularly useful when the relationship between the two sets of data is not linear.
For example, if we have data on people’s happiness levels and their income, we might find that there is a relationship between the two, but an increment in income is not linearly proportional to an increment in happiness, the relation does not follow a straight line.
In this case, Spearman’s correlation works better with respect to other correlation coefficients (such as the Pearson’s one).
More specifically, we will try to correlate the year in which a Grand Slam match was played to the number of winners and of break points it includes. We will proceed surface by surface, starting from the most ancient one, the grass of Wimbledon.
Also Read:
- Why do Tennis Fans Have a Love-Hate Relationship with Pickleball?
- Everything You Wanted to Know About Tennis Racket Stringing Machines
Have Grass Courts Become Slower?
The underlying idea is that, if the grass is getting slower and slower, it should be increasingly harder to make a winner shot and easier and easier to get chances for a break, considering that the initiative which is a prerogative of the serving player should be easier to handle for the returning player on slower surfaces.
Yet, it would not be wise to directly compute the Spearman’s coefficient between the considered years (2011-2023) and the average number of winners/break points per match in that year.
In fact, if an edition were characterized by longer matches, it would have, most likely, both more winners and more break points: not due to the speed of the surface but, more simply, to the increased number of points played.
So, firstly, we turn the absolute values of the statistics of our interest into ratios, thus handling the “noise” due to matches of different durations.
In other words, we compute, for each match, the ratio of winners and of break points with respect to the total number of points played. Then, we compute the average value of these ratios for each year, starting from 2011 until today.
Finally, we compute the Spearman’s correlation coefficient between the years and the average ratios.
The Spearman’s correlation between the year in which the tournament was held and the average winner ratio (with respect to the total number of points played) is strongly negative: -0.839, while it is clearly positive, equal to 0.741, for what concerns the ratio of break points (again, with respect to the total number of points played).
Indeed, the more years pass since 2011 until today, the harder it seems to make a winner shot and the easier it seems to have a break point. This is, at least, highly compatible with the fact that grass gets slower and slower, and possibly also most players are adapting to it (with the recent evident exception of Alcaraz, often going for winner shots, even taking big risks), further enhancing the phenomenon.
What about Clay and Hard Courts?
Now, we repeat the analysis for clay (considering Roland-Garros as our benchmark) and on hard (here we focus on Australian Open and US Open).
Again, the reference period still starts from the year of Federer’s public declaration (2011) and encompasses the tournaments held from that year (included) until today.
On clay, both correlations seem a little weaker: the values of Spearman’s coefficient are -0.536 (winner ratio) and 0.455 (break points ratio). This could also be compatible with the hypothesis that courts are getting slower: clay, already the slowest surface, is less impacted, in terms of style of play, with respect to grass, the fastest one.
But what about hard? Here, the result look more contradictory: both Spearman’s coefficients are negative and not so strong: -0.573 (winner ratio) and -0.497 (break points).
Summing up, with this exploratory analysis, there seem to be significant clues that grass, and possibly clay, are still getting slower, while the situation is more unclear on hard.
Thinking back to the strong statistical evidence that we found on grass, and to the images of the Wimbledon court, close to the baseline (where most of the play, nowadays, happen) during the second week of Wimbledon, we could also wonder: could it be that degradation too has an impact, making grass more similar to clay in some areas of the court, and contributing to the slowdown of the fastest surface?
Numbers seem to corroborate this idea: if we repeat the test only considering data referring to the first three rounds of play (hence with less degradation), the Spearman’s coefficient correlating year of play and winner ratio is -0.216 and, concerning break points, it gets even closer to 0, even if still slightly positive: 0.097.
Maybe, looking at the numbers more analytically helped us in better understanding and measuring this phenomenon, even without exploring specialistic fields such as science of the materials, but simply observing the data concerning the matches.


